Riverside County, CA Property Research
Real data from four public sources, not an internal estimate: the EPA's radon zone classification, Census housing-age records, FEMA's natural hazard risk index, and NOAA's recorded storm history for this county. Every figure below links to where it actually comes from.
Hazard Summary
Radon Risk
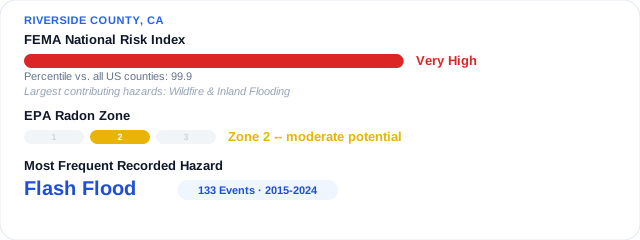
Zone 2 -- moderate potential. EPA predicts an average indoor radon screening level between 2 and 4 pCi/L for this county.
This is a county-wide prediction from geology and soil data, not a measurement of any specific home -- EPA recommends testing every home regardless of zone. See our guide on negotiating radon mitigation after inspection.
Source: EPA Map of Radon ZonesHousing Age
Riverside County has 860,042 housing units. About 17% were built in 1969 or earlier -- old enough that knob-and-tube wiring, lead-based paint, and galvanized supply lines are all realistic possibilities worth checking for, not just a general inspection line item.
Does knob-and-tube wiring have to be replaced before closing?
Source: U.S. Census Bureau, ACS 5-Year Estimates, Table B25034Natural Hazard Risk
FEMA rates Riverside County's overall natural hazard risk as Very High, relative to the rest of the country.
Recorded Storm History (2015-2024)
NOAA recorded 373 storm events in Riverside County between 2015 and 2024. This is actual event history, not a risk model -- the counts below are individually logged storms, not a prediction.
Guides Relevant to This County's Housing Stock
Get Your Free Property Report
BeforeRegret pulls live seismic hazard data, validates the address, and builds era- and county-specific inspection priorities and seller questions into one report -- with anything not yet independently verified clearly labeled, not guessed at.
Get Your First Report FreeThis page reports what these four public agencies have published for Riverside County as a whole -- it is not an assessment of any specific address or property, and does not replace a licensed home inspection, radon test, or insurance review for a specific home. Data last checked August 10, 2026.