Monthly index · US Census Building Permits Survey · year to date through July 2026
American residential building permits are almost exactly level with last year — 852,234 units against 852,819, a change of +0.1%. That number is a composite of two opposite movements, and it is the only one most people will read. Three of the four categories the Census Bureau counts fell. The one that rose is apartment buildings.
Source: US Census Bureau, Building Permits Survey, county files; analysis by Before Regret. Data through July 2026, rebuilt monthly, so check the date before quoting a figure.
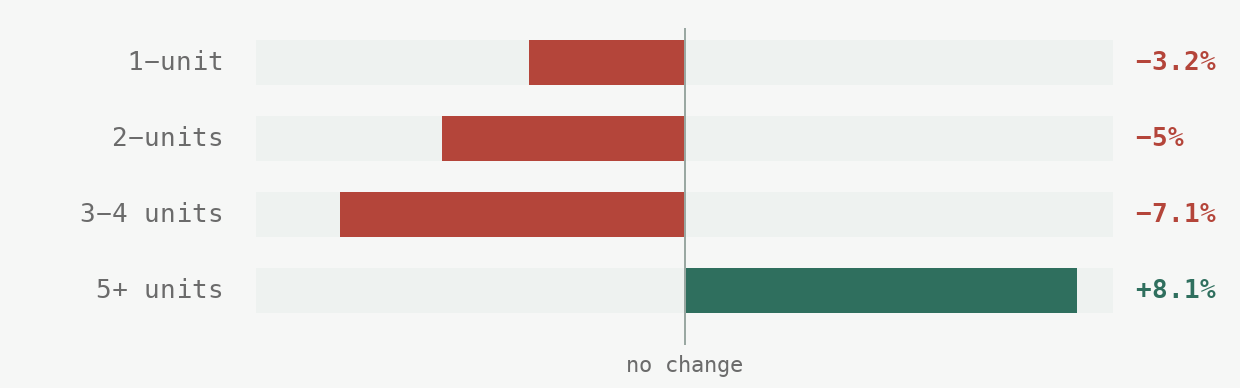
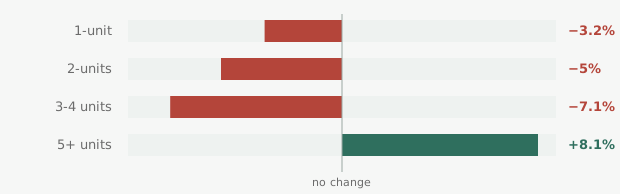
Change in permitted units by structure size, year to date through July, 2025 against 2026. Source: US Census Bureau, Building Permits Survey.
Single-family permits are −3.2%, from 565,344 to 547,278 units. Two-unit buildings are −5%; three- and four-unit buildings −7.1%. Only buildings of five units or more — the multifamily category — rose, by +8.1%: 20,501 additional units, which is more than enough to offset the 18,066 houses that were not permitted this year.
A year in which three of four construction categories declined reports as +0.1% and is described as flat. The composite is not wrong. It is just not about houses.
Across the 567 counties large enough to measure reliably, 285 — 50% — permitted fewer single-family homes than in the same months of 2025. This is not concentrated in one region: those counties sit across 50 states.
290 of those counties permitted more housing units this year than last. In 72 of them — 25% — single-family permits fell at the same time. In those places a true statement about the local permit total carries the opposite implication about the house market.
| County | Houses 2025 | Houses 2026 | Houses | All units |
|---|---|---|---|---|
| Tarrant County, TX | 5,716 | 5,548 | −2.9% | +9.4% |
| King County, WA | 1,532 | 1,490 | −2.7% | +87.2% |
| Fulton County, GA | 1,473 | 1,304 | −11.5% | +13.9% |
| Denver County, CO | 565 | 486 | −14% | +78% |
| Fairfax County, VA | 511 | 453 | −11.4% | +14% |
| Collier County, FL | 1,305 | 1,284 | −1.6% | +14.7% |
| Snohomish County, WA | 1,205 | 1,150 | −4.6% | +4.6% |
| Weld County, CO | 1,599 | 1,414 | −11.6% | +12.9% |
| Brazos County, TX | 1,051 | 929 | −11.6% | +73.5% |
| Chesterfield County, VA | 1,062 | 840 | −20.9% | +30.7% |
| Washoe County, NV | 1,032 | 822 | −20.3% | +15.8% |
| Tulsa County, OK | 1,299 | 1,065 | −18% | +15.7% |
The 12 largest counties by permit volume where the total rose and single-family fell. Full list in the CSV below.
| # | County | Houses 2025 | Houses 2026 | Houses | All units |
|---|---|---|---|---|---|
| 1 | Mecklenburg County, NC | 3,057 | 322 | −89.5% | −45.9% |
| 2 | Mohave County, AZ | 1,315 | 440 | −66.5% | −67.3% |
| 3 | Mercer County, NJ | 861 | 303 | −64.8% | −53.1% |
| 4 | Pitt County, NC | 830 | 368 | −55.7% | +54% |
| 5 | Newton County, GA | 443 | 201 | −54.6% | −52.1% |
| 6 | Caldwell County, NC | 347 | 165 | −52.4% | −11.5% |
| 7 | Midland County, TX | 875 | 471 | −46.2% | −46.2% |
| 8 | Charles County, MD | 689 | 380 | −44.8% | −44.8% |
| 9 | Jessamine County, KY | 330 | 187 | −43.3% | −44.3% |
| 10 | Madera County, CA | 871 | 523 | −40% | −42.2% |
| 11 | Washington County, OR | 1,128 | 697 | −38.2% | +24.7% |
| 12 | Cass County, ND | 413 | 257 | −37.8% | −22.7% |
Counties permitting at least 250 houses in 2025, ranked by the change in single-family permits. Smaller counties are left out because a handful of houses there swings the percentage wildly.
| # | County | Houses 2025 | Houses 2026 | Houses | All units |
|---|---|---|---|---|---|
| 1 | Kaufman County, TX | 675 | 1,633 | +141.9% | +159% |
| 2 | Rankin County, MS | 255 | 544 | +113.3% | +113.3% |
| 3 | Stanislaus County, CA | 445 | 796 | +78.9% | +88.8% |
| 4 | Prince William County, VA | 428 | 744 | +73.8% | +73.8% |
| 5 | Taylor County, TX | 399 | 678 | +69.9% | +127.9% |
| 6 | Potter County, TX | 269 | 423 | +57.2% | +122.1% |
| 7 | Ector County, TX | 496 | 766 | +54.4% | +54.4% |
| 8 | Lee County, AL | 831 | 1,264 | +52.1% | +102.8% |
| 9 | Okaloosa County, FL | 486 | 736 | +51.4% | +41.6% |
| 10 | Jackson County, MS | 316 | 477 | +50.9% | +42% |
| 11 | Catawba County, NC | 856 | 1,256 | +46.7% | +29.3% |
| 12 | Chesapeake(Independent City), VA | 293 | 427 | +45.7% | +130.2% |
The same counties, ranked the other way.
The Census Bureau's Building Permits Survey publishes residential permits for every US county each month. This compares the year-to-date file through July 2026 against the file for the same months of 2025, so the two cover identical calendar windows. Both files are linked at the foot of this page.
3,020 counties appear in the Census file and 567 of them are shown here. If yours is missing, it is for one of two reasons.
It is too small for a percentage to mean anything. 2,141 counties permitted fewer than 100 units in one of the two years. Where a county permitted eleven houses, a single subdivision is a ninety-percent swing.
Too much of the number is estimated. The Census Bureau imputes permit counts for offices that do not report, and the file marks which units were actually reported. In 312 counties fewer than 80% of the units were reported by an actual permit office, so they are left out. In some the figure is entirely modelled — hundreds of units on file for a county where no office reported anything. That is an estimate of a county rather than a record of it.
Permits are not completions. A permit is an intention to build, filed at the start. Some of these units will not be finished, and the ones that are will be finished across several years.
Units are not buildings. The apartment figures count units, so a single approval can move a county by hundreds. The house figures count buildings and units together, because a single-family permit is one of each.
This is a count, not an explanation. Interest rates, land cost, local zoning changes, labour, insurance and disaster rebuilding all plausibly contribute to any county's movement, and nothing here separates them. Where a county's figure looks dramatic, the cause is usually local and specific, and finding it means reading that county's own records.
These figures are revised. The Census Bureau updates earlier months as late reports arrive, so a county's number can shift slightly between one month and the next.
The chart above, as a file you can put in a story: PNG · SVG. The county table, all 567 rows: CSV · JSON.
Credit line: “analysis of US Census Bureau Building Permits Survey data by Before Regret”, linking to this page.
Cite as: Before Regret, “Permit Pulse: US residential building permits by county,” data through July 2026, https://www.beforeregret.com/research/permit-pulse/
Free to reuse with attribution under CC BY 4.0. Every figure on this page is computed by Before Regret from the Census Bureau files named below. Nothing is restated from another publisher, and the derived table is published so the arithmetic can be checked.
Source files:
co2607y.txt and
co2507y.txt,
US Census Bureau, Building Permits Survey.
Put the county search on your own page. It updates when this index does, and carries its own credit line.
<iframe src="https://www.beforeregret.com/research/permit-pulse/embed/"
        width="100%" height="380" style="border:1px solid #dfe5e2"
        title="US building permits by county: houses vs apartments"
        loading="lazy"></iframe>
It posts its own height to the parent page as beforeRegretEmbedHeight.